Your true return: why it's more than the share price
29 June 2026 · Girish Patil · Founder, Metrifly
Founder of Metrifly. Writes about Australian portfolio tracking, CGT, dividends, and tax reporting for self-directed investors.
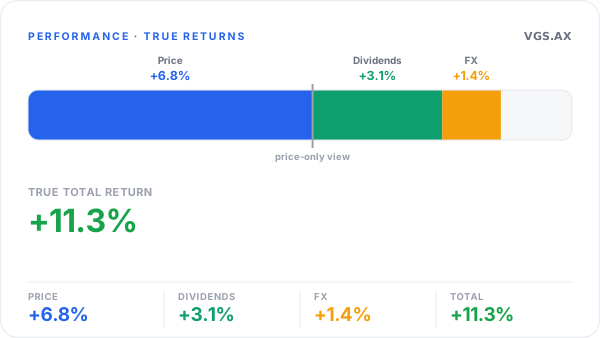
Open most brokerage apps and the number you see is the share price change. It’s the easiest figure to show — and it quietly undercounts how your money actually did. Your true return has more than one moving part, and the parts it leaves out are often the ones doing the work.
This is general information about performance measurement, not financial advice.
Return has three parts
For an Australian investor, total return breaks down into three components:
- Capital gain — the change in the asset’s price.
- Income — the dividends and fund distributions paid to you (including reinvested ones through a DRP).
- Currency — for anything held offshore, the movement in the exchange rate translated back to Australian dollars.
Add them together and you get the figure that actually matters: what your money earned, in your home currency, after everything.
A worked example
Take an international shares ETF over a year. The price did fine, but not spectacularly:
| Component | Contribution |
|---|---|
| Price (capital) | +6.8% |
| Dividends / distributions | +3.1% |
| Currency (FX) | +1.4% |
| True total return | +11.3% |
A price-only view would tell you +6.8%. The real answer — once income and a favourable currency move are counted — is +11.3%, nearly two-thirds higher. Judge the holding on price alone and you’d badly underrate it.
Why the price-only view misleads
The gap between “+6.8%” and “+11.3%” isn’t an edge case; it’s the norm for income-paying and offshore holdings:
- Income compounds. Dividends are real money. Reinvested, they buy more units that pay their own dividends — the effect builds over years.
- Currency cuts both ways. A rising overseas market can be muted by a strengthening Australian dollar, or amplified by a falling one. Either way, ignoring FX means your AUD return is wrong.
- Benchmarks include income. Accumulation indices assume dividends are reinvested. Comparing your price-only return to a total-return benchmark isn’t a fair fight — you’ll look worse than you are.
Separating the three components also tells you where a return came from. A “good year” that was mostly currency is a very different result from one driven by the businesses you own.
How to see your true return
- Track price, income and currency as separate, add-up-able parts of one number — that’s how Metrifly’s performance tracking reports return, across every broker and currency. The help guide explains how returns are calculated, and the methodology page covers the maths.
- For a fair comparison against the market, measure against a total-return benchmark over the same window, not a price index.
For the tax treatment of those dividends, see franking credits explained; for gains when you sell, capital gains tax on shares.
Summary
Your true return is price plus income plus currency — not the share price alone. The components a price-only view drops, dividends and FX, are often the ones carrying the result. Measure all three, compare against a total-return benchmark, and you’ll finally know what your money really earned.