Portfolio Performance
Know your true return, not just your balance.
Time-weighted and money-weighted returns, benchmark comparison, drawdown and risk — across every broker, after fees and FX, updated daily.
Free forever · No credit card required
Imports from 100+ brokers
Real positions, not estimated snapshots.
 CommSec
 Stake
Stake SelfWealth
 Interactive Brokers
 Pearler
 Superhero
Performance, measured properly
Every angle on how your money is working.
The same metrics a professional would demand, calculated automatically from your transactions.
Time-weighted return
TWR strips out the timing of your deposits, so you can compare your portfolio to a benchmark on equal footing.
Money-weighted (MWR)
MWR factors in the size and timing of every contribution: the actual return you earned on your cash.
Benchmark comparison
Plot your portfolio against the ASX 200, S&P 500, or any index, with outperformance shown in percentage points.
Risk and drawdown
Maximum drawdown, volatility, and Sharpe ratio show how much risk you took to earn your return.
FX-adjusted returns
Currency gain is tracked separately from market gain, so you see what the asset did versus what the dollar did.
Down to the holding
Top and bottom performers, contribution to return, and weight — ranked across every account you hold.
Two returns, both right
TWR and MWR, side by side.
A single return number hides as much as it reveals. Metrifly shows time-weighted return for benchmark-fair comparison and money-weighted return for what you actually earned, so you always know which question you're answering.
- Time-weighted return, annualised, for fair comparison
- Money-weighted return that respects your contribution timing
- Both shown over 1M, 3M, 6M, 1Y or all time
Beat the market, or know you didn't
See yourself against the index.
Plot your portfolio against the ASX 200 or any major benchmark. Outperformance is shaded and quantified, so the comparison is honest.
- Daily benchmark prices for major global indices
- Outperformance in percentage points
- Compare any date range against the same window
Return is only half the story
Understand the risk you took.
Maximum drawdown and the Sharpe ratio tell you how much risk earned your return. A calm 12% and a white-knuckle 12% are very different results, and Metrifly shows which one you had.
- Maximum peak-to-trough drawdown with dates
- Sharpe ratio: return per unit of risk
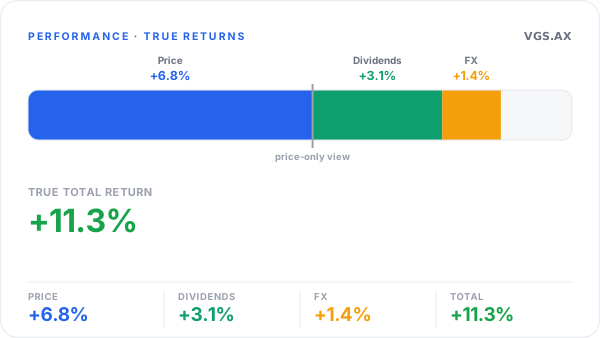
Where your return comes from
Price is only part of the story.
Your real return is the share-price move, plus the dividends you received, plus the currency move on anything held offshore. Metrifly separates all three, so a modest price gain that's actually a healthy total return doesn't go unnoticed.
- Capital, income and currency split out
- Dividends and FX added on top of price
- Total return, not price alone
How your money is spread
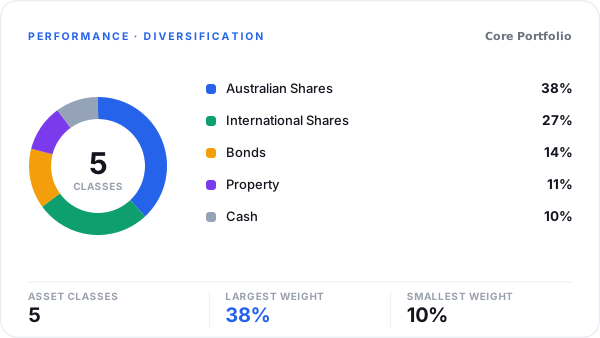
See your real allocation.
Concentration is risk that never shows up on a returns chart. Metrifly breaks your portfolio down by asset class, sector, region, currency and holding type, so you can tell at a glance whether one name or one theme is quietly running the show.
- Allocation by asset class, sector, region and more
- Largest and smallest weights surfaced
- Spot concentration before it bites
FAQ
Performance questions, answered.
What is the difference between time-weighted and money-weighted return?
Time-weighted return (TWR) removes the effect of deposits and withdrawals, which makes it the fair way to compare your investing against a benchmark. Money-weighted return (MWR) accounts for when and how much you contributed, so it reflects the return you actually experienced on your money; Metrifly computes it using the Modified Dietz method. Metrifly shows both side by side.
Which benchmarks can I compare against?
Major indices including the ASX 200, S&P 500, and others. Benchmark prices are updated daily so the comparison line stays current alongside your portfolio.
Are returns calculated after fees and FX?
Yes. Brokerage and fees are included, and for multi-currency portfolios the FX component of your return is separated from the underlying market movement so you can see each clearly.
How often is performance updated?
Daily, from live end-of-day prices. Your market value, returns, drawdown and risk metrics refresh automatically — no manual recalculation.
Keep exploring
Income and tax run on the same data.
See what you actually earned.
Connect your brokers and get true, after-fee performance across your whole portfolio. Free to start.
Free forever · No credit card required